
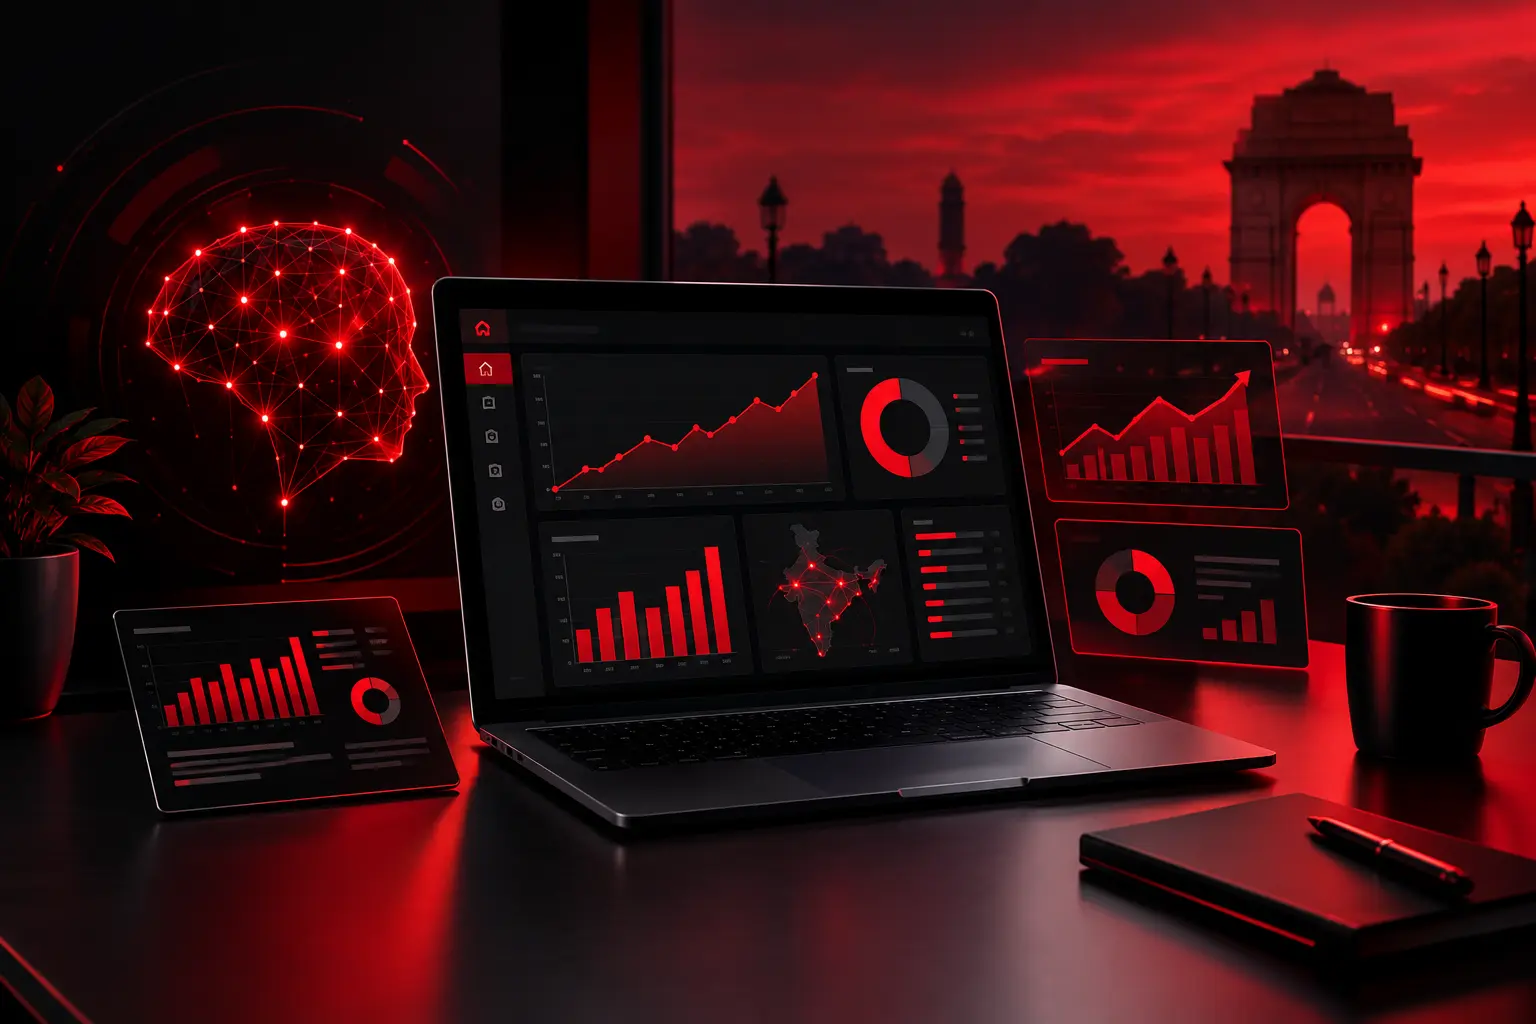
Advanced AI Predictive Analytics & Reporting Dashboards
AI-powered predictive analytics helps businesses use historical and current data to identify patterns, trends, and potential future outcomes. Our team combines data analysis, AI-powered insights, automated reporting, and customized dashboards to make business information easier to understand and act upon.
From marketing performance and sales data to customer behavior and campaign results, we help businesses transform scattered information into organized dashboards and actionable insights.
Our AI Predictive Analytics & Reporting Dashboard Services

AI Predictive Analytics
Analyze historical and current business data to identify trends, patterns, and potential opportunities. Our AI-powered approach helps businesses understand performance and make more informed decisions
GET QUOTE
Business Intelligence Dashboards
Create customized dashboards that bring important business and marketing data into one centralized view, making complex information easier to monitor and understand.
GET QUOTE
Marketing Analytics Dashboards
Track key marketing metrics such as traffic, leads, conversions, campaign performance, advertising spend, and ROI through clear and organized dashboards.
GET QUOTE
Sales Performance Analytics
Monitor leads, sales, revenue, conversion rates, and pipeline performance to get a clearer understanding of your sales activities and results.
GET QUOTE
Customer Behavior Analytics
Analyze customer interactions, engagement, and available behavioral data to better understand your audience and support more personalized marketing strategies.
GET QUOTE
Predictive Performance Analysis
Use historical data to identify patterns and potential future trends, helping businesses plan campaigns, resources, and marketing activities more effectively.
GET QUOTE
FOR AI Predictive Analytics & Reporting Dashboard Services
Click and Get Now.

AI Predictive Analytics & Reporting Dashboard Services
Chat with us via WhatsApp.
Our AI Predictive Analytics & Reporting Dashboard Process
Business & Data Understanding
We first understand your business goals, available data, reporting requirements, and key performance indicators. This helps us define what information needs to be tracked and analyzed.
Data Collection & Integration
We identify relevant data sources and organize the information required for analytics and reporting. Where supported, different data sources can be connected to create a centralized reporting system.
Data Cleaning & Preparation
We review and structure the collected data to improve its consistency and usability. This creates a reliable foundation for analytics, reporting, and dashboard development.
KPI & Reporting Planning
We identify the most important KPIs and metrics for your business. The dashboard structure is then planned around the information you need to monitor regularly.
AI Analytics & Pattern Analysis
We analyze historical and current data to identify important trends, patterns, and performance changes. These insights help provide a clearer understanding of your business performance.
Predictive Analysis
Where sufficient historical data is available, predictive analysis can be used to identify potential trends and future patterns. This can support better planning and data-driven decision-making.
Dashboard Development
We create a customized reporting dashboard with relevant charts, graphs, tables, KPI indicators, and filters. The dashboard is designed to make complex data easier to understand.
Testing & Data Validation
We check data connections, calculations, KPIs, filters, and dashboard elements to ensure that the information is presented correctly and consistently.
Deployment & Reporting
After testing, the dashboard is prepared for regular business use. Your team can use the reporting system to monitor important performance information from a centralized view.
LET’S START YOUR PROJECT..
Our Satisfied Clients








OUR EXPERTISE – INDUSTRIES

Doctors

Real Estate

Lawyers

E-Commerce

Education & Ed-Tech

Interior Design

Finance

Healthcare & HealthTech

Technology

Skin Care

Tour and Travel

Packers and Movers
Why Choose Digital Ultras for AI Predictive Analytics & Reporting Dashboards

AI + Analytics Expertise
We combine AI-powered analytical approaches with digital marketing and business performance knowledge to create useful reporting solutions.

Customized Dashboard Solutions
Every business has different reporting requirements. We create dashboard structures around your specific KPIs, data sources, and objectives.

Data-Driven Approach
We focus on meaningful data and performance metrics to help businesses understand what is happening across their marketing and business activities.

Actionable Business Insights
Our dashboards are designed not just to display numbers but to make important trends, patterns, and performance changes easier to identify.

Marketing Performance Focus
Our digital marketing expertise allows us to create reporting views for important areas such as SEO, PPC, leads, conversions, traffic, and campaign performance.

Transparent Reporting
We provide clear reporting structures that help businesses understand their performance data and the metrics being monitored.
GOOGLE REVIEWS

After doing a lot of efforts I’m not able to get the results for my business. Then I came to know about Digitalultras and contact them . I had a great experience with them. I found the best technical provisions with aspirants.I found this as the best Angular Development Company in Delhi.
-Rohit Singla
Our website’s transformation by Digital Ultras, it was outstanding. They’ve created a visually appealing and user-friendly site that has improved our online credibility. It’s a pleasure working with their talented web development team. Go with them to a Angular Development Company in Delhi.
-Vineet Pal
Digital Ultras’ performance marketing services are nothing short of groundbreaking. Their innovative approach to online advertising has propelled our business to new heights. With creative campaigns and cutting-edge strategies, they consistently deliver exceptional results. Highly recommended for businesses seeking to stay ahead of the curve.
-Kabeer Singh
aDigital Ultras’ social media marketing services have been a game-changer for our brand. Their innovative strategies have significantly increased our social media engagement, leading to greater brand visibility and customer interaction. With Digital Ultras, our social media presence has never been stronger.
-Shreya Rathi
Thanks to Digital Ultras’ SEO expertise, our website’s visibility has skyrocketed. They’ve worked tirelessly to optimize our site for search engines, resulting in higher rankings and increased organic traffic. With Digital Ultras at the helm of our SEO strategy, we’re confident that our website will continue to climb the search engine rankings.
-Gaurav Verma
Digital Ultras doesn’t just create campaigns; they craft experiences that leave a lasting impression. Their ability to connect with audiences on a deeper level sets them apart from the competition. Whether it’s through captivating visuals, compelling storytelling, or interactive content, they know how to make every campaign impactful and memorable. With Digital Ultras, your brand will leave a lasting impression.
-Shivani Sharma
CONTACT US NOW
Let us help your business to move forward
Frequently Asked Questions (FAQ)
What is AI Predictive Analytics?
AI Predictive Analytics uses historical and current data with analytical or AI-assisted methods to identify patterns, trends, and potential future outcomes.
What is a Reporting Dashboard?
A reporting dashboard is a centralized visual interface that displays important business metrics, KPIs, charts, graphs, and performance information.
What Data Can Be Used for Predictive Analytics?
Depending on the business, data can include sales, marketing campaigns, website traffic, customer behavior, conversions, revenue, advertising performance, and other historical business information.
Can You Create Marketing Analytics Dashboards?
Yes. Marketing dashboards can be designed to monitor metrics such as traffic, leads, conversions, advertising performance, campaign results, and other relevant KPIs.
Can Predictive Analytics Forecast Business Performance?
Predictive analytics can identify patterns and estimate potential future outcomes based on available historical and current data. The accuracy depends on factors such as data quality, quantity, relevance, and the analytical method used.
Can You Integrate Different Data Sources?
Yes. Where technically supported, relevant data sources can be connected or combined to create a more centralized reporting environment.
Can You Track KPIs in Real Time?
Real-time or near-real-time reporting depends on the data source, integration, platform, and dashboard setup. Some systems can provide automatically updated information.
Can E-Commerce Businesses Use Predictive Analytics?
Yes. E-commerce businesses can use analytics to understand sales trends, customer behavior, product performance, marketing results, and other business metrics.